
The Wolf Pack Power Brief ·
ICONIQ published its annual software growth report this month, and then did something unusual with it.
ICONIQ’s study of 137 software companies shows two populations instead of one curve, and a median that no longer works as a planning number.
- By Paulo Veloso
- 7 min read

For years that report has been a set of aggregate benchmarks. Medians, quartiles, the state of the market in one number per metric. This year they broke from it, and the reason they gave should stop every revenue leader mid-scroll: the aggregate still describes the market, but it no longer identifies the winners.
They studied 137 software companies through Q2 2026. What they found is not a curve any more. It is two populations, and the gap between them is widening fast enough that the median has stopped being a useful planning input.
They called it The Great Sorting. The name is doing a lot of work.
The market repriced, and then the top quartile left
Start with the backdrop, because it is worse than most people realize. The software index fell 3% over the trailing year. That is the worst performing sector in the S&P, in a year when semiconductors gained 47% on AI compute demand. Frontier models made in-house application development meaningfully more accessible, and multiples compressed across every software sub-sector as a result.
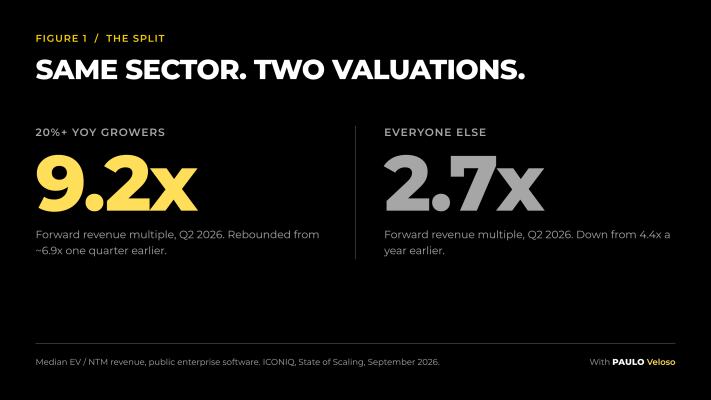
Inside that backdrop, something else happened. Public software companies growing 20% or more year over year now trade at a 9.2x forward revenue multiple. Everyone else trades at 2.7x. Same sector, same quarter, same macro. The high growers rebounded from roughly 6.9x one quarter earlier. The rest kept sliding, down from 4.4x a year ago.
That is not a spread. That is two different markets wearing the same label.
The top cohort is compressing the timeline
ICONIQ calls the top group Pacesetters: top-quartile revenue growth over three years, and either AI-native or AI-driven. Median age six years. 65% horizontal, 70% pricing on a consumption or hybrid model. It is a living cohort, so companies enter and exit as they cross the threshold.
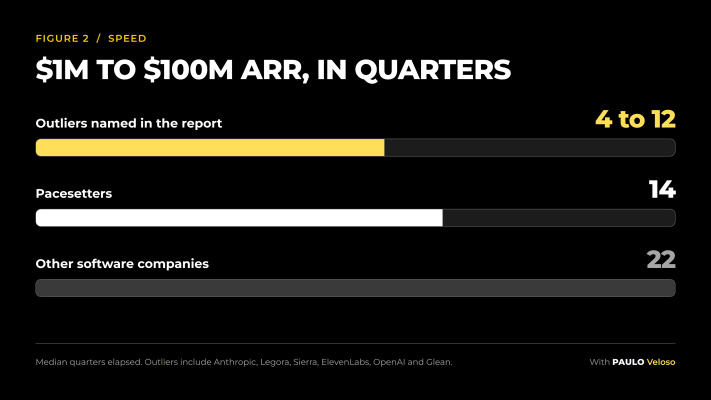
Here is what that cohort does to the clock. The median software company takes 22 quarters to go from $1M to $100M ARR. Pacesetters do it in 14. And a named group of outliers inside that cohort, which includes Anthropic, Legora, Sierra, ElevenLabs, OpenAI and Glean, is compressing it into one to three years.
If you have ever built a plan around "five to seven years to $100M," that assumption is now describing the slow half of the market.
It is an acquisition story, not an expansion story
This is the finding I would put in front of every board, because it cuts against a decade of received wisdom.
At sub-$100M Pacesetters, 74% of gross new ARR comes from new logos. For their peers it is 54%. Above $100M the split is 71% against 46%. The outperformance is not coming from squeezing the installed base. It is coming from winning new customers faster than everybody else.
Net retention still matters, and they have it. Median net dollar retention of 120% against 102% for peers, with the top quartile reaching 136% below $100M and 146% above it. But retention is compounding the new-logo engine, not substituting for it.
The report carries its own warning here, and it is worth quoting to anyone planning a shift toward expansion: de-emphasizing new-logo acquisition too early, around $500M ARR, can undermine the revenue model before the business is ready for the transition.
Most software companies have been leaning on the base because the base is cheaper to sell to. The data says the companies winning right now decided that was a false economy.
The edge is bought, and the invoice is visible
Here is the part most summaries will leave out, and it is the part that makes the rest of it honest.
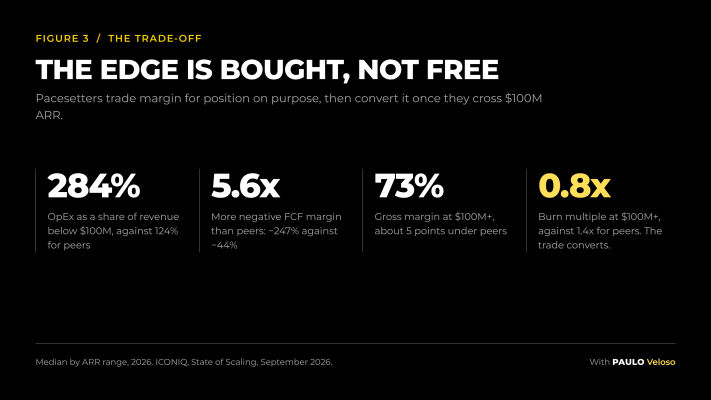
That performance is purchased. Sub-$100M Pacesetters spend 284% of revenue on operating expense, against 124% for their peers, with most of the gap concentrated in sales and marketing. Their median free cash flow margin is negative 247%, against negative 44% for peers. Roughly 5.6 times more unprofitable, deliberately.
Gross margin is under pressure too. At $100M and above, Pacesetters run about 73% against 78% for peers, roughly five points lower, reflecting inference, infrastructure and deployment cost that traditional software never carried.
So it is fair to ask whether this is just expensive growth with a good story attached.
The answer arrives at scale. Above $100M ARR, the same cohort posts a burn multiple of 0.8x against 1.4x for peers. They generate more revenue per dollar burned than the companies that spent less. The sequence is spend ahead of scale early, then prove return per dollar once the engine is real. That is a bet with a proof point attached, and the proof point shows up on schedule.
Your buyers already told you what to change
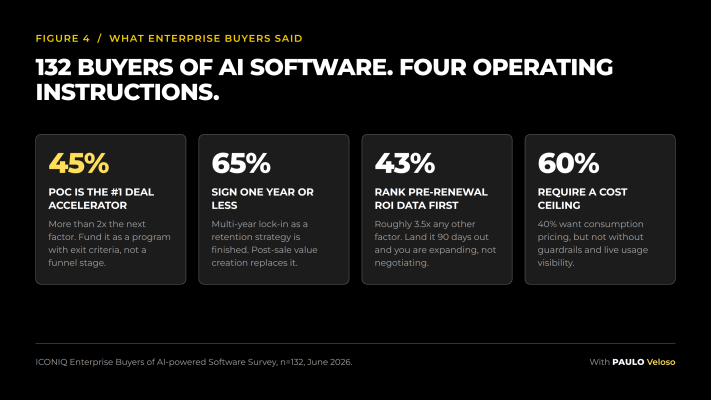
Buried inside the report is a survey of 132 enterprise buyers of AI-powered software. If you read nothing else, read this section, because every finding converts directly into something you can change this quarter.
45% named a fast, flexible proof of concept with clear success criteria as the single biggest accelerator of a deal. More than twice the next factor. Most teams still treat the POC as a stage in the funnel. It is not a stage. It is a program, and it needs an owner, a clock and written exit criteria.
Three roles decide the deal: the sales engineer or solutions architect, the security and compliance lead, and the product specialist. Notice who is not on that list. Buyers are underwriting whether the thing works in their environment, not whether they enjoyed the call with your account executive.
65% will only sign contracts of one year or less. Multi-year lock-in as a retention strategy is finished. What replaces it is post-sale value creation you can evidence.
43% said usage and return data shared ahead of the renewal is the number one thing that makes renewal easier, roughly 3.5 times any other factor. Land that report two weeks out and you are negotiating. Land it ninety days out and you are expanding.
And on pricing: 40% want consumption or hybrid models, but 60% require a cost ceiling and real-time usage visibility before they will accept one. Consumption pricing does not die in the pitch. It dies in procurement, because nobody built the guardrails
Adoption is no longer the story. Across the companies ICONIQ surveyed, 99% of sales and marketing employees have access to AI tools, 98% in research and development, 97% in general and administrative functions. Daily usage runs 74%, 86% and 70% respectively.
Where it lands, the results are real. Reported outcomes include a 15 to 30% win rate uplift, two to three times more qualified opportunities per rep, 75 to 100% of committed code being AI-generated, and top-quartile revenue per employee at $100M+ companies rising from $315K in 2022 to 2023 up to $478K in 2026.
Now the uncomfortable observation. Functional headcount mix across the entire dataset is essentially unchanged. Sales and marketing, engineering and administration take up the same share of the org that they did three years ago.
Read that again. AI is making people faster inside an organizational design built for a slower market. Nobody has redrawn the chart.
That is the opening. I do not think it stays open much past eighteen months, because the first companies to redesign the shape of the organization rather than the speed of its people will make the productivity gap structural rather than temporary.
One more thing worth holding onto, as a counterweight to the code-generation headline everyone will repeat. In one internal test at a company in the study, roughly ten autonomous agents opened about 180 pull requests and none of them passed continuous integration. Authoring stopped being the constraint. Verification became it.
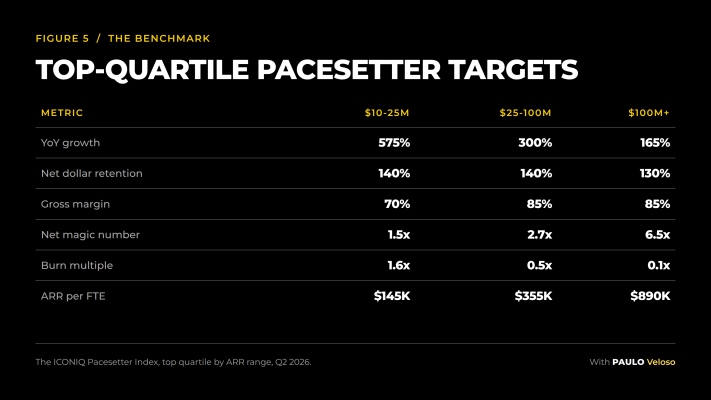
The benchmark, if you want a target instead of a median
Here is the top quartile of the Pacesetter cohort by revenue band. Not the median. The bar the winning half is clearing.
Five moves for the next ninety days
- Re-benchmark the plan to the top quartile rather than the median. If your 2027 plan is calibrated to a 2024 median, you are planning against a population that is currently being sorted out of the market.
- Audit your new-logo to expansion mix and be honest about what is actually carrying the number. If expansion is doing more than half the work and you are under $500M, you may be harvesting a base rather than building one.
- Make the proof of concept an inspectable stage in your commit gate, with a named owner, a clock and written exit criteria. It is the number one deal accelerator by a factor of two and most teams run it informally.
- Put usage and return reporting on the renewal calendar ninety days out, not two weeks out. It is the top renewal factor by roughly 3.5 times and it is entirely within your control.
- Build the consumption guardrails before you build the consumption pricing. Cost ceilings and live usage visibility are what get the model through procurement.
None of these require budget you do not have. All five require deciding that the medians you have been planning against describe a market that no longer exists.
Which side of the sorting is your plan built for?
If you are working through any of this inside your own revenue organization, I would rather hear the argument than the agreement. Tell me in the comments which of the five you would do first, and which one you think is wrong.
Let's go build something that sells.
Also published on LinkedIn .